Model Implementation
1. BERT Transformer Model with “review” as input and “voted_up” as output
The BERT model (Bidirectional Encoder Representations from Transformers) is a pre-trained transformer-based language model designed to understand text context bidirectionally. We leveraged it for text classification by fine-tuning it on our dataset to predict whether a review was positive (voted_up).
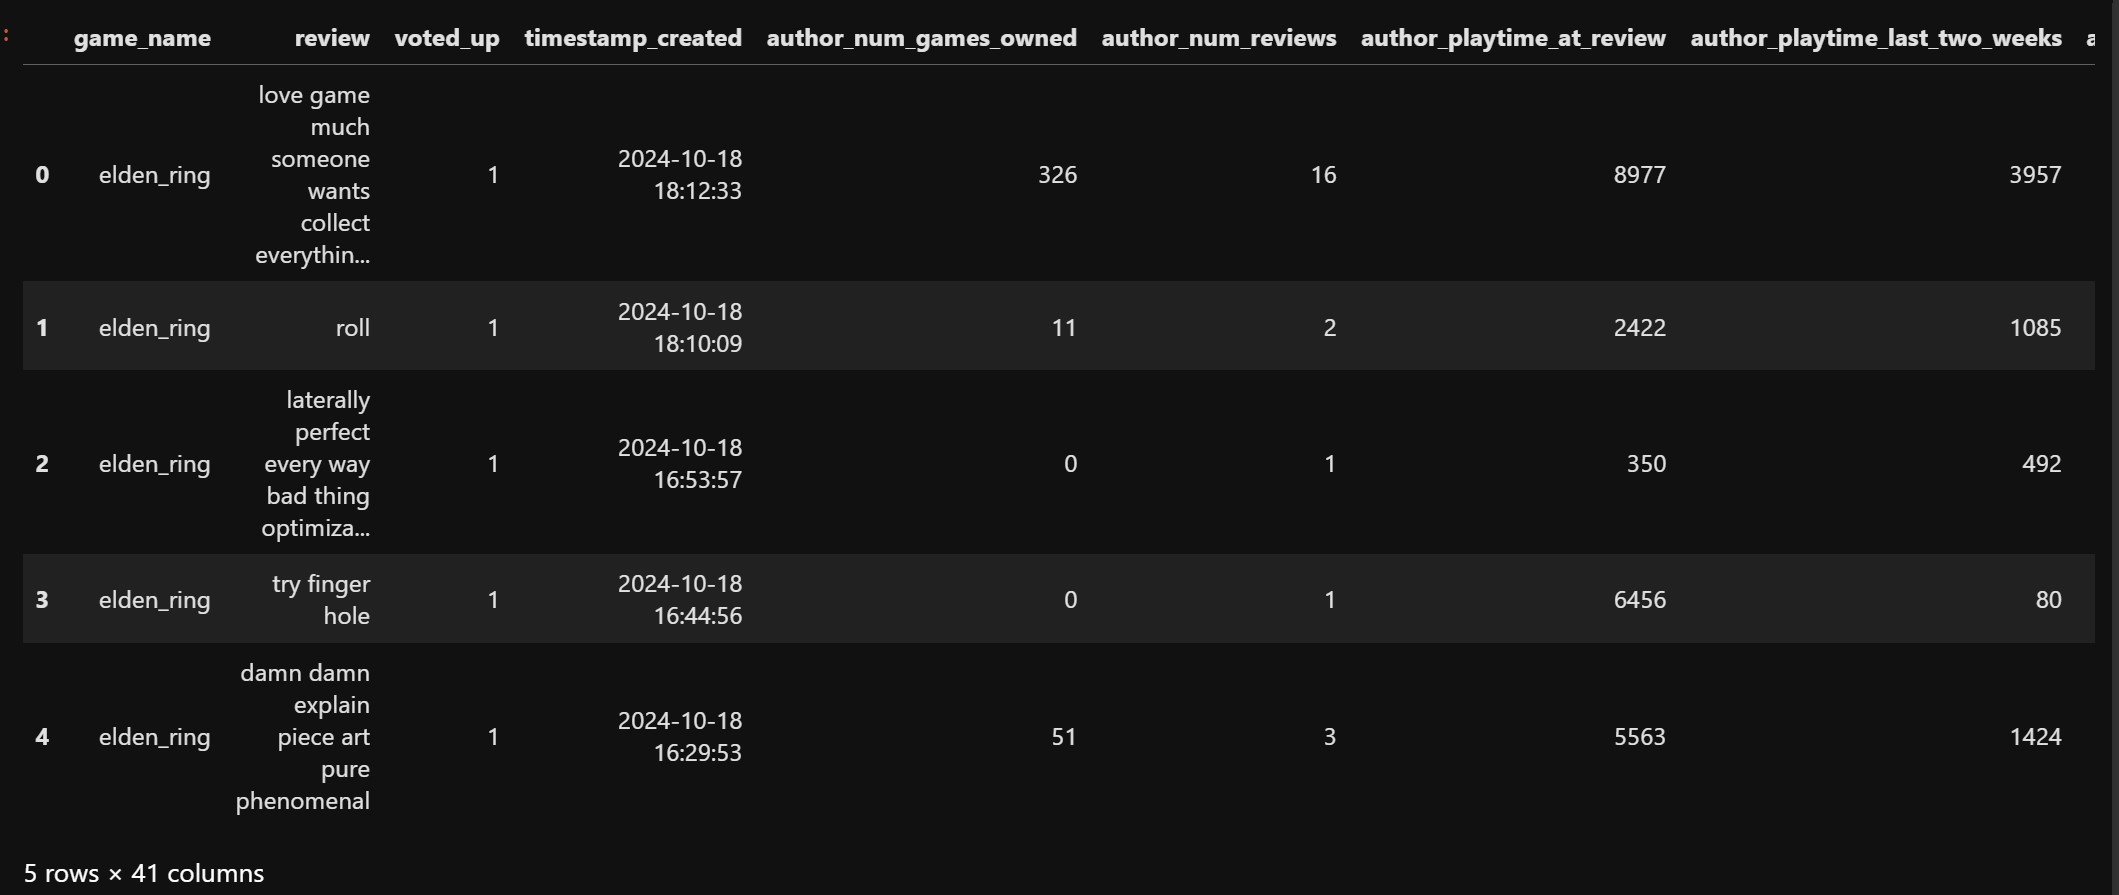
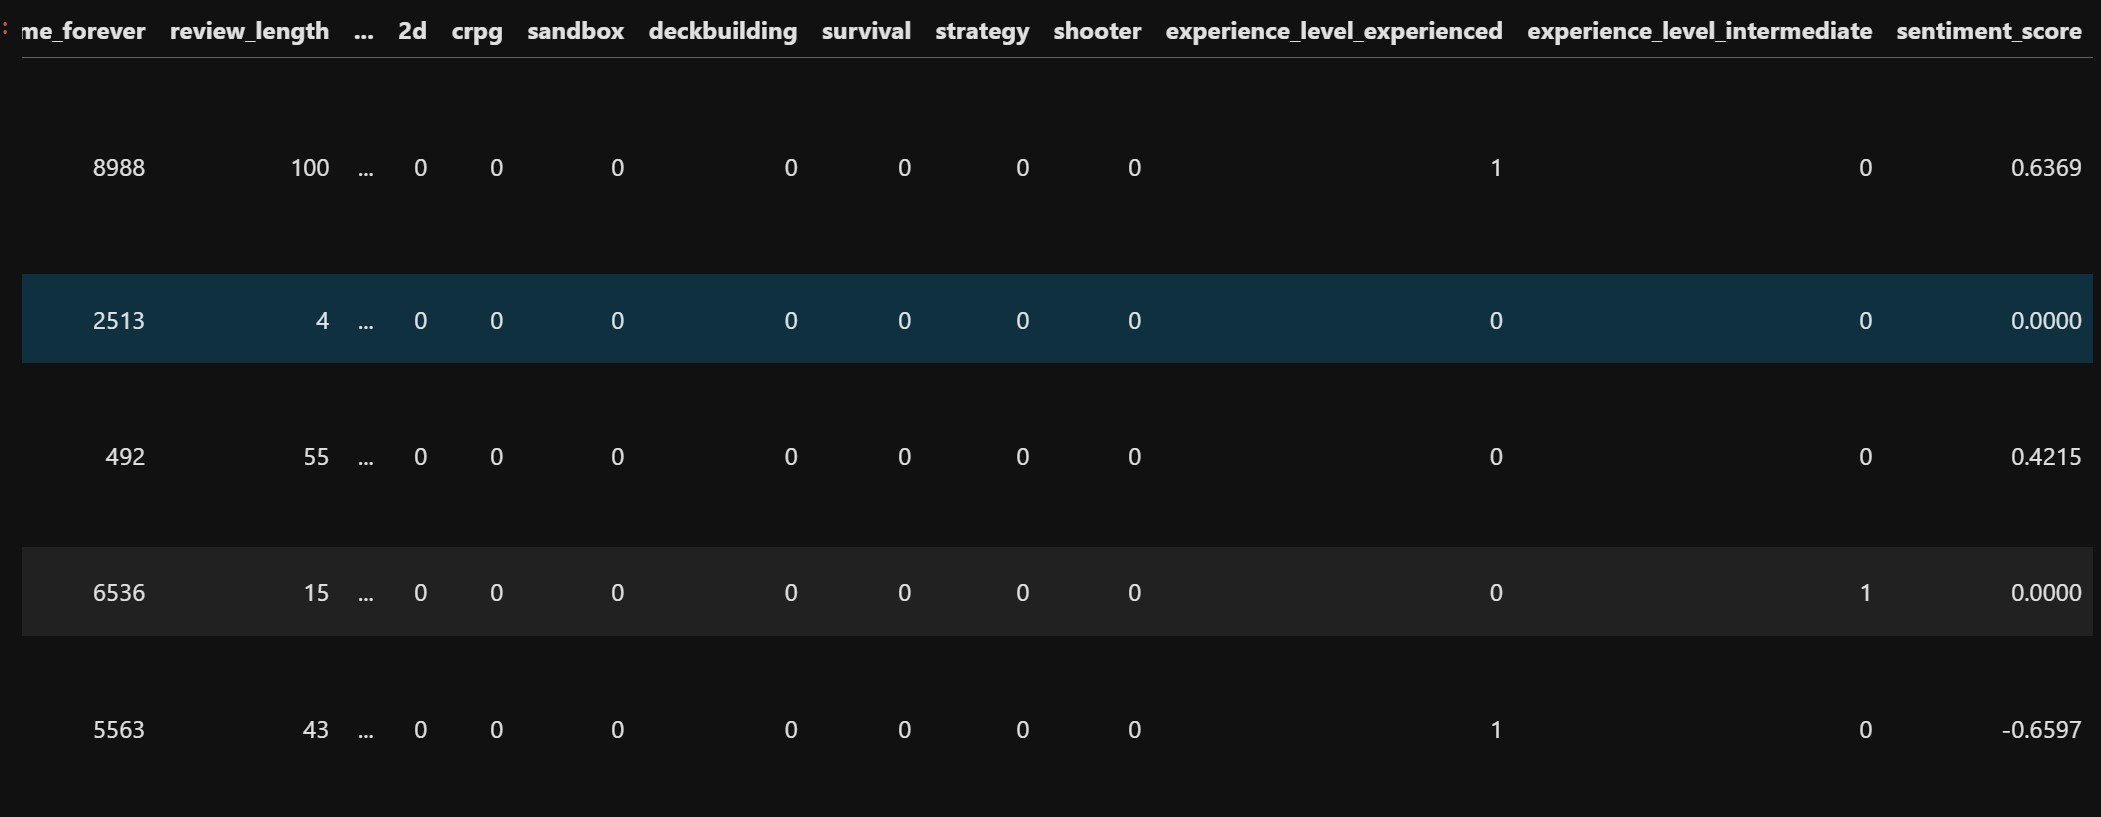
We will first load in our featured_reviews.csv into a dataframe. We take our “review” feature as X or our input and take “voted_up” as y or our output. The data initially looks like this:
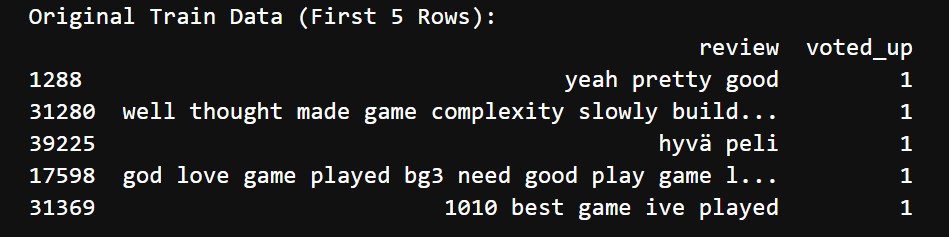
BERT model first tokenizes this text data before training. Before tokenizing our data looked like this
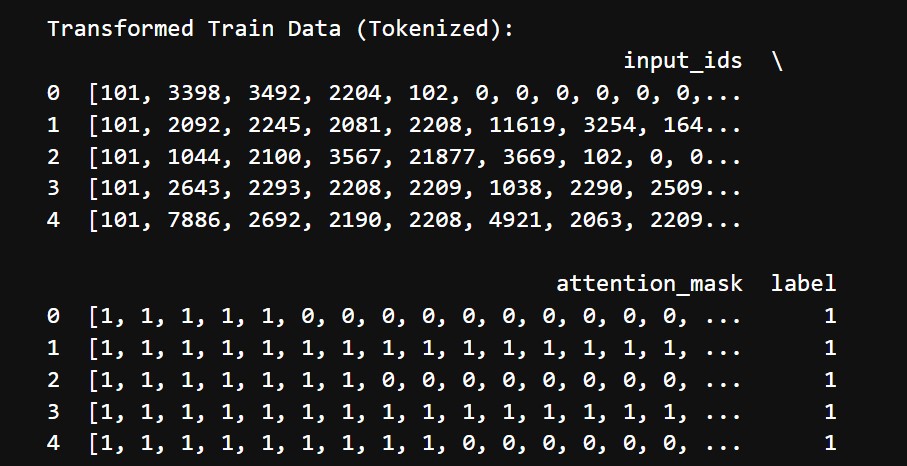
The tokenized transformed data looks like this:
Our processing involves the following steps:
- Used BERT's pre-trained tokenizer (bert-base-uncased) to tokenize the review text
- Each review was:
- Split into tokens
- Converted into unique token IDs (input_ids)
- Padded or truncated to a maximum length of 128 tokens
- Generated an attention_mask to indicate which tokens should be attended to
- Created a ReviewDataset class to manage the tokenized inputs and corresponding labels
- Split the dataset into training and testing sets (X_train, y_train, X_test, y_test)
The model training involved the following:
- Architecture:
- Fine-tuned the bert-base-uncased model for binary classification
- Added a classification head on top of BERT to predict the voted_up label (output layer with sigmoid activation for probabilities)
- Training Configuration:
- Optimized with AdamW (specific for transformers)
- Loss function: Binary Cross-Entropy Loss
- Metrics: Accuracy, F1-Score
- Batch size: Adjusted to fit the GPU memory
- Learning rate: Fine-tuned with a warm-up scheduler for stable convergence
After training the BERT model, we evaluated it on the test set. Below are the results:
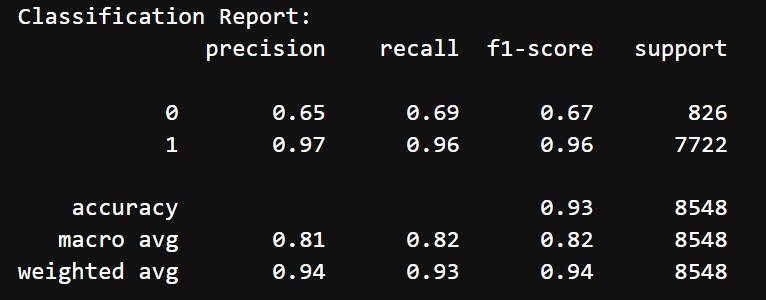
- Accuracy: 93%
- Classification Report:
- Class 0 (Negative reviews):
- Precision: 65%
- Recall: 69%
- F1 Score: 67%
- Class 1 (Positive reviews):
- Precision: 97%
- Recall: 96%
- F1 Score: 96%
- Macro Average: Precision = 81%, Recall = 82%, F1-Score = 82%
- Class 0 (Negative reviews):
The model performs exceptionally well for positive reviews (class 1), which dominate the dataset. Performance for negative reviews (class 0) is weaker, with lower precision and recall. The overall weighted metrics indicate a robust model for predicting review positivity
To try to improve our model we will incorporate more features into the next model.
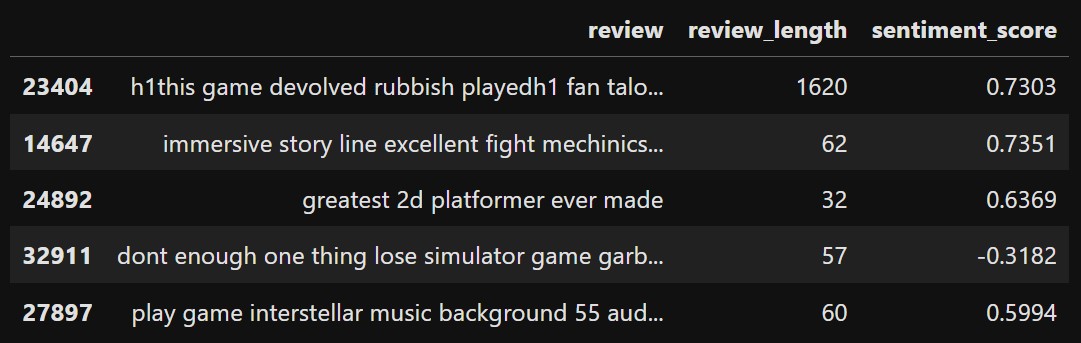
2. BERT Transformer Model with “review”, “review_length” and “sentiment_score” as input and “voted_up” as output
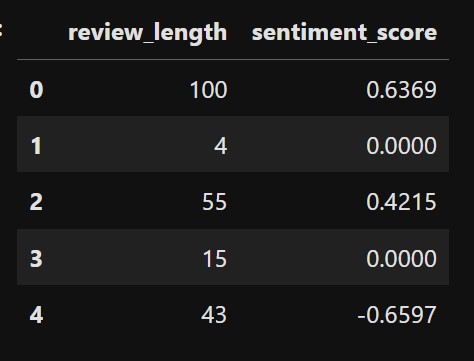
We make another BERT transfomer model but incorporate two more numerical features along with the review column. We take “review”, “review_length” and “sentiment_score” as our input X and “voted_up” as our output y. Our data looks like this:
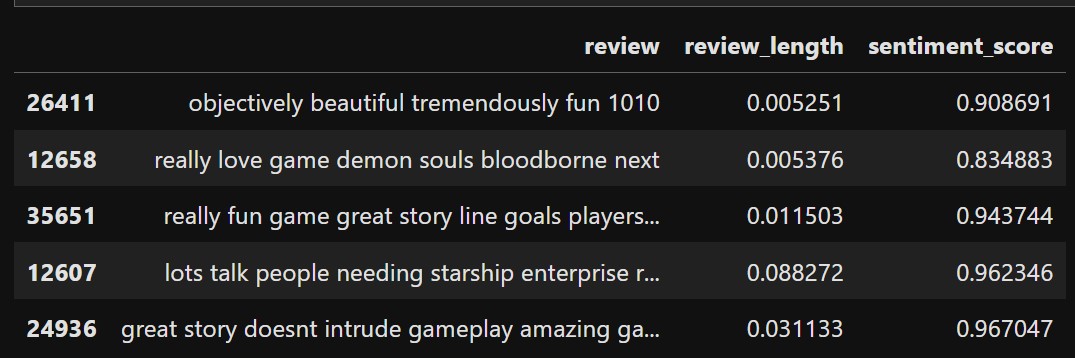
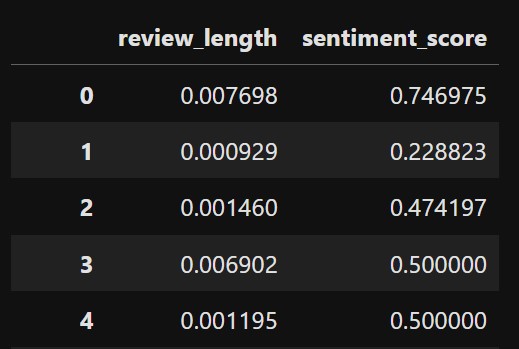
The numerical columns are normalized by min-max scaling. The data now looks like this:
The review column is tokenized in the same manner as the previous and looks like this after transformation again:
The processing steps are similar to the previous model:
- Used the BertTokenizer to tokenize the review text into input_ids and attention_mask
- Created a custom Dataset class (ReviewDataset) to include:
- Text Features: Tokenized input IDs and attention masks
- Numerical Features: Normalized review_length and sentiment_score
- Labels: voted_up
- The key difference is that the __getitem__ method was updated to return both numerical features and tokenized text features, making the dataset compatible with the combined BERT model
To incorporate both text and numerical features, a custom BERT-based model was designed:
- Base Model: Used the pre-trained bert-base-uncased model. Extracted the CLS token's representation (768 dimensions) from the BERT output as a summary of the review's meaning
- Numerical Features Integration:
- Concatenated the CLS token output with the normalized numerical features
- Adjusted the fully connected layer to accept an input size of 768 + len(numerical_cols) (to account for the numerical features)
- Classification Layer:
- Used a fully connected layer with 2 output neurons (for binary classification)
- Added a dropout layer for regularization
The model was trained similar to the previous model:
- Optimized using the AdamW optimizer with a learning rate of 2e-5
- Used Cross-Entropy Loss as the objective function
- Trained over 3 epochs, with a batch size of 16
- The key difference being that the forward pass now included the concatenated CLS token and numerical features
After training this new BERT model, we evaluated it on the test set. Below are the results:
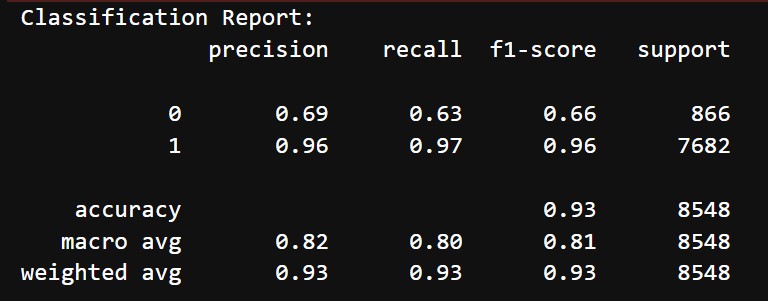
- Accuracy: 93%
- Classification Report:
- Class 0 (Negative reviews):
- Precision: 69%
- Recall: 63%
- F1 Score: 66%
- Class 1 (Positive reviews):
- Precision: 96%
- Recall: 97%
- F1 Score: 96%
- Macro Average: Precision = 82%, Recall = 80%, F1-Score = 81%
- Class 0 (Negative reviews):
Adding the additional features (review_length and sentiment_score) did not improve the model's performance. Overall, while there was a minor gain in precision for negative reviews, the drop in recall led to no significant improvement in the overall metrics.
3. LightGBM Classifier Model with “review”, “review_length” and “sentiment_score” as input and “voted_up” as output
We will now use a LightGBM classifier model to try to model the same relationship. The data looks like this again:
The numerical columns are again normalized and the data looks like this:
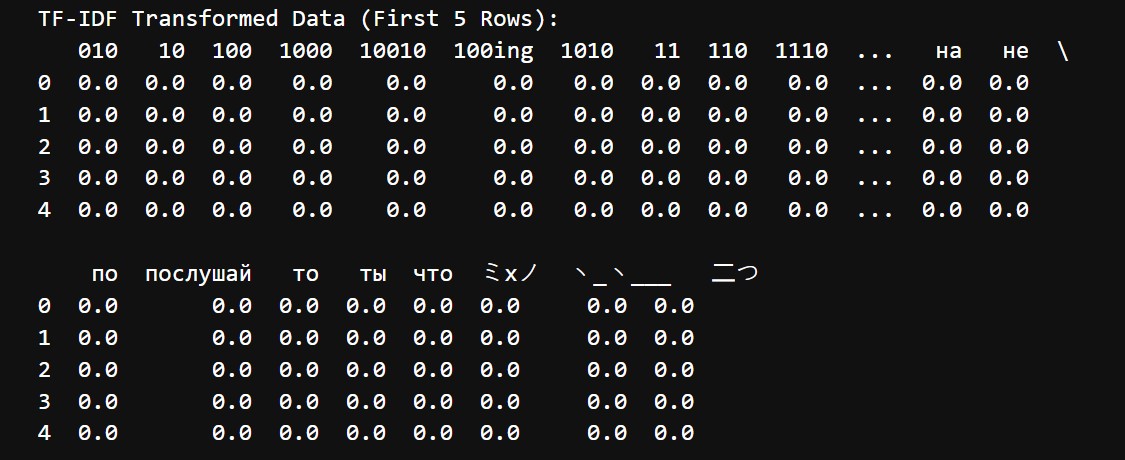
The review data is transformed for it to work with our classifier model. The transformation involves converting raw review text into numerical features using TF-IDF (Term Frequency-Inverse Document Frequency). This step allows text data to be represented numerically for machine learning models. The steps are:
- Tokenization: The TfidfVectorizer splits each review into individual words (tokens)
- Vocabulary Creation: Builds a vocabulary of the most frequent 5000 words across all reviews
- TF-IDF Score Calculation: Assigns a score to each word based on its frequency in the review (Term Frequency) and its rarity across all reviews (Inverse Document Frequency)
- Sparse Matrix Representation: Converts each review into a row of numerical values (TF-IDF scores), where:
- Rows = Reviews
- Columns = Words in the vocabulary
- Values = Importance of the word in that review
The transformed data looks like this:
We used LightGBM (LGBMClassifier), a gradient boosting framework that is highly efficient for handling large datasets and sparse matrices (like our TF-IDF + numerical features). The model was initialized with the parameter class_weight="balanced" to handle class imbalance between positive (voted_up=1) and negative (voted_up=0) reviews.
The model was trained on the combined feature set of:
- TF-IDF matrix: Captures the textual content of the review
- Scaled numerical features: review_length and sentiment_score
Hyperparameter Tuning: To improve the model’s performance, we conducted a Grid Search over a reduced parameter space to find the best combination of hyperparameters. The following parameters were tuned:
- learning_rate: Controls how much the model adjusts weights after each boosting round
- n_estimators: The number of boosting rounds
- max_depth: The depth of each decision tree
- subsample: The proportion of samples used for training each tree
- colsample_bytree: The proportion of features used for training each tree
Threshold Adjustment: In the best parameter model, we adjusted the decision threshold (default is 0.5) to optimize performance for different class priorities. The steps were the following:
- Obtained prediction probabilities using model.predict_proba
- Tested thresholds ranging from 0.1 to 0.9
- Evaluated metrics (precision, recall, F1-score) for each threshold
The results before hyperparameter tuning and threshold adjustment are the following:
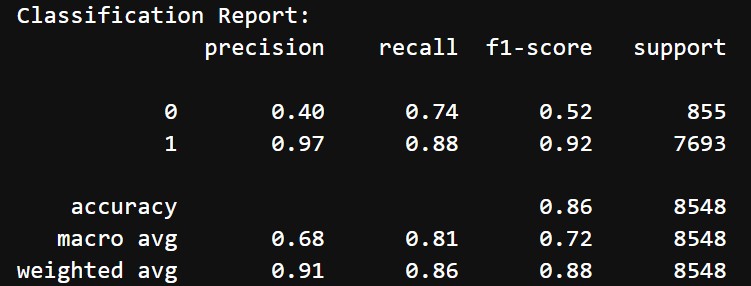
- Accuracy: 86%
- Classification Report:
- Class 0 (Negative reviews):
- Precision: 40%
- Recall: 74%
- F1 Score: 52%
- Class 1 (Positive reviews):
- Precision: 97%
- Recall: 88%
- F1 Score: 92%
- Macro Average: Precision = 68%, Recall = 81%, F1-Score = 72%
- Class 0 (Negative reviews):
After tuning and threshold adjust, the following were the results:
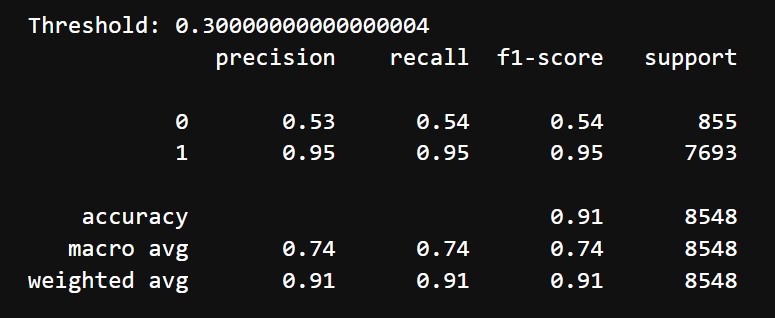
- Accuracy: 91%
- Classification Report:
- Class 0 (Negative reviews):
- Precision: 53%
- Recall: 54%
- F1 Score: 54%
- Class 1 (Positive reviews):
- Precision: 95%
- Recall: 95%
- F1 Score: 95%
- Macro Average: Precision = 74%, Recall = 74%, F1-Score = 74%
- Class 0 (Negative reviews):
After hyperparameter tuning and threshold adjustment, the LightGBM model showed improvements in balancing precision and recall for Class 0 (negative reviews). Precision and recall for Class 0 became 53% and 54%, raising the F1-score from 52% to 54%. Class 1 (positive reviews) maintained strong performance, with an F1-score of 95%, and the overall accuracy increased from 86% to 91%. While the model successfully enhanced detection of negative reviews, the F1-score for Class 0 remains moderate due to class imbalance. The macro average F1-score improved to 74%. These results indicate that the tuning effectively balanced performance between classes, though further techniques might be required to address residual challenges in negative review detection.
4. Ensemble Stacking Model using LightGBM, Logistic Regression and Naïve Bayes with “review”, “review_length” and “sentiment_score” as input and “voted_up” as output
We try to use an ensemble model for modelling the same relationship. The dataset is the same which looks like this after scaling:
The review is transformed again in a similar way as the last LightGBM model and it again looks like this:
Ensemble models combine predictions from multiple base models to improve overall performance by leveraging the strengths of each model. We implemented a stacking ensemble model, which:
- Combines predictions from multiple base models
- Uses a meta-model (final estimator) to learn from these predictions and make the final decision
- LightGBM Classifier
- A gradient boosting model, good for handling sparse data and complex patterns
- Parameters: class_weight='balanced', random_state=42
- Logistic Regression
- A simple linear model, effective for linearly separable data
- Parameters: max_iter=1000
- Multinomial NB
- A probabilistic model, particularly suited for text data
- Works well when features (e.g., TF-IDF) are conditionally independent
Each base model was trained on the training set. Predictions from these models were combined into new features for the meta-model. The meta-model was trained on the combined predictions to make the final decision
Hyperparameter Tuning: To further optimize the stacking model, we performed hyperparameter tuning using grid search. The grid search used 3-fold cross-validation and was optimized for the weighted F1-score. The following following parameters were tuned:
- LightGBM Parameters
- n_estimators: Number of boosting rounds ([100, 150])
- learning_rate: Step size for weight updates ([0.05, 0.1])
- max_depth: Depth of each tree ([3, 5])
- Logistic Regression Parameters (Meta-Model):
- C: Regularization strength ([0.1, 1.0]).
We will also do threshold adjustment from 0.1 to 0.9. A threshold value of 0.8 gave the most optimal results so we choose this.
Before hyperparameter tuning and threshold adjustment we got the following results:
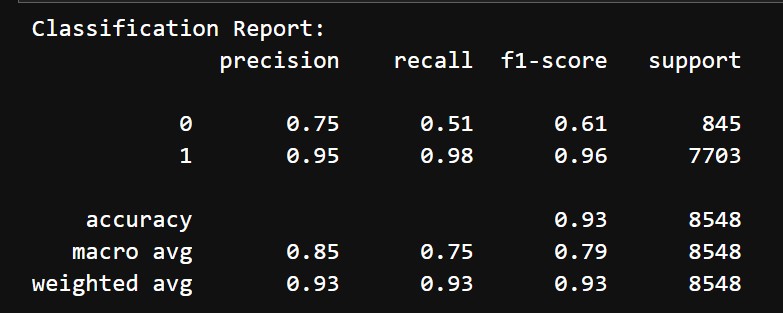
- Accuracy: 93%
- Classification Report:
- Class 0 (Negative reviews):
- Precision: 75%
- Recall: 51%
- F1 Score: 61%
- Class 1 (Positive reviews):
- Precision: 95%
- Recall: 98%
- F1 Score: 96%
- Macro Average: Precision = 85%, Recall = 75%, F1-Score = 79%
- Class 0 (Negative reviews):
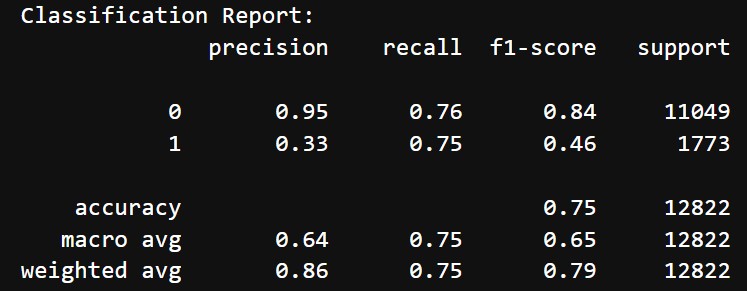
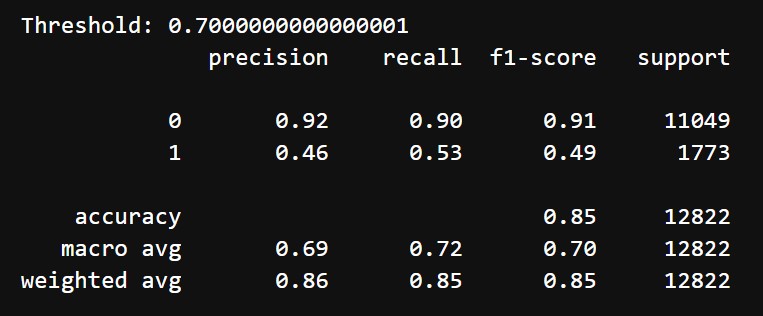
After tuning and choosing threshold of 0.7, we got the following results:
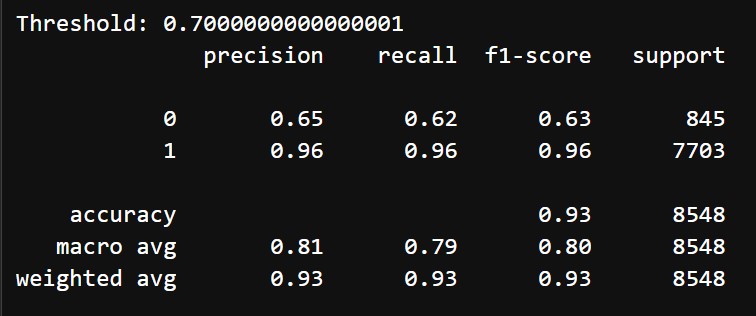
- Accuracy: 93%
- Classification Report:
- Class 0 (Negative reviews):
- Precision: 65%
- Recall: 62%
- F1 Score: 63%
- Class 1 (Positive reviews):
- Precision: 96%
- Recall: 96%
- F1 Score: 96%
- Macro Average: Precision = 81%, Recall = 79%, F1-Score = 80%
- Class 0 (Negative reviews):
The stacking ensemble model initially performed decent, achieving a macro F1-score of 79% and high precision and recall for Class 1 (positive reviews). However, Class 0 (negative reviews) struggled with a low recall of 51% and an F1-score of 61%, indicating room for improvement in identifying negative reviews. After hyperparameter tuning and adjusting the decision threshold to 0.7, the model showed a better balance for Class 0, with precision improving from 75% to 65% and recall increasing from 51% to 62%. Although the F1-score for Class 0 rose marginally to 63%, the performance for Class 1 remained robust, with a precision and recall of 96%. Overall accuracy remained consistent at 93%, and the macro-average F1-score improved slightly, indicating that threshold adjustment effectively enhanced the model's ability to identify negative reviews without sacrificing the performance for positive reviews
5. Bagging Model using LightGBM Classifier with “review”, “review_length” and “sentiment_score” as input and “voted_up” as output
We make an ensemble model by bagging the LightGBM Classifier and try to model the same relationship. The dataset is the same which looks like this after scaling:
The review is transformed again in a similar way as the last ensemble model and it again looks like this:
Bagging (Bootstrap Aggregating) combines multiple instances of a base model to reduce variance and improve stability. Each base model is trained on a random subset of the data (with replacement), and predictions are aggregated to produce the final result.
We implemented a BaggingClassifier using LightGBM as the base estimator. It has the following key parameters:
- Base Estimator: LightGBM (class_weight='balanced', random_state=42) to handle class imbalance and capture complex relationships
- Bagging Parameters:
- n_estimators: Number of base models
- max_samples: Fraction of training samples used by each base model
- max_features: Fraction of features used by each base model
To optimize the BaggingClassifier, we performed hyperparameter tuning using grid search on a small search space to maintain efficiency. The grid search used 3-fold cross-validation and was optimized for the weighted F1-score. All 3 parameters are tuned:
- n_estimators: [5, 10]
- max_samples: [0.6, 0.8]
- max_features: [0.6, 0.8]
After training the BaggingClassifier with the best parameters, we will also do threshold adjustment from 0.1 to 0.9. A threshold value of 0.4 gave the most optimal results so we choose this.
Before hyperparameter tuning and threshold adjustment we got the following results:
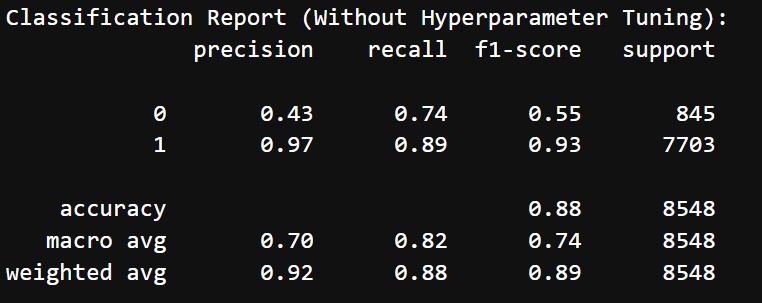
- Accuracy: 88%
- Classification Report:
- Class 0 (Negative reviews):
- Precision: 43%
- Recall: 74%
- F1 Score: 55%
- Class 1 (Positive reviews):
- Precision: 97%
- Recall: 89%
- F1 Score: 93%
- Macro Average: Precision = 70%, Recall = 82%, F1-Score = 74%
- Class 0 (Negative reviews):
After tuning and choosing threshold of 0.4, we got the following results:
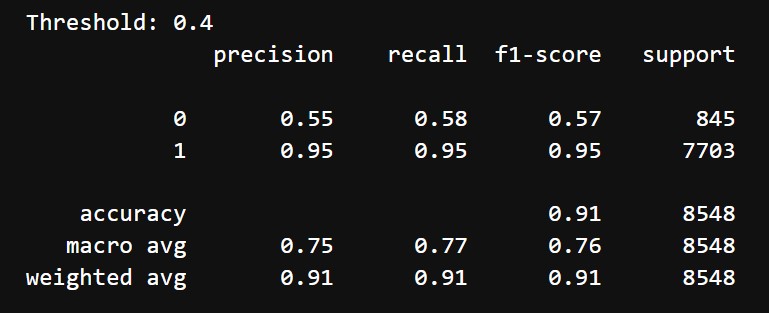
- Accuracy: 91%
- Classification Report:
- Class 0 (Negative reviews):
- Precision: 55%
- Recall: 58%
- F1 Score: 57%
- Class 1 (Positive reviews):
- Precision: 95%
- Recall: 95%
- F1 Score: 95%
- Macro Average: Precision = 75%, Recall = 77%, F1-Score = 76%
- Class 0 (Negative reviews):
The BaggingClassifier model initially performed reasonably well, achieving an accuracy of 88% and a macro average F1-score of 74%. However, Class 0 (negative reviews) had a low F1-score of 55% due to its relatively low precision (43%) and moderate recall (74%). After hyperparameter tuning and adjusting the threshold to 0.4, the model showed an improvement in balancing performance for Class 0. Precision for Class 0 increased to 55%, while recall descreased to 58%, resulting in a better F1-score of 57%. The performance for Class 1 (positive reviews) remained strong, with a precision and recall of 95%. The overall accuracy increased to 91%, and the macro-average F1-score rose to 76%, reflecting a better balance between the two classes.
6. LightGBM Model with “review_length”, “sentiment_score” as input and “mentions_difficulty” as output
We will try to predict if a review mentions difficulty using review meta data like length and sentiment score. We will try to model review_length and sentiment_score to mentions_difficulty
This model aimed to predict whether a review mentions difficulty (mentions_difficulty) using two features: review_length and sentiment_score. Given the significant imbalance in the target variable, with far fewer reviews mentioning difficulty, a combination of under-sampling and over-sampling techniques was used to create a balanced training dataset.
Our Input dataset will initially look like this:
Both the numerical columns are scaled and they look like this now:
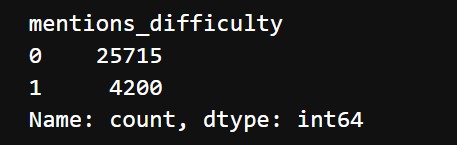
The output classes are imbalanced. They look like this:
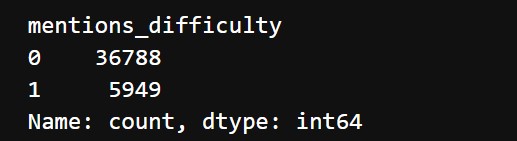
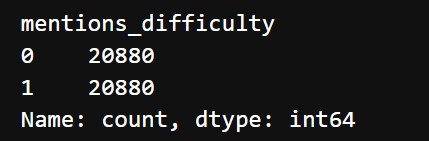
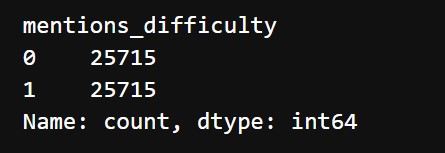
We use both undersampling and oversampling and the data now looks like this:
The LightGBMClassifier was used for training, leveraging its ability to handle class imbalance with the class_weight='balanced' parameter. Hyperparameter tuning was conducted using GridSearchCV, with 3 fold cross validation, to optimize the following parameters with respect to F1 score:
- n_estimators: Number of boosting rounds ([50, 100])
- max_depth: Maximum depth of each decision tree ([3, 5])
- learning_rate: Learning rate for boosting ([0.05, 0.1])
- colsample_bytree: Fraction of features used for each tree ([0.8, 1.0])
After tuning we also do threshold adjustment from 0.1 to 0.9. A threshold value of 0.7 gave the best results
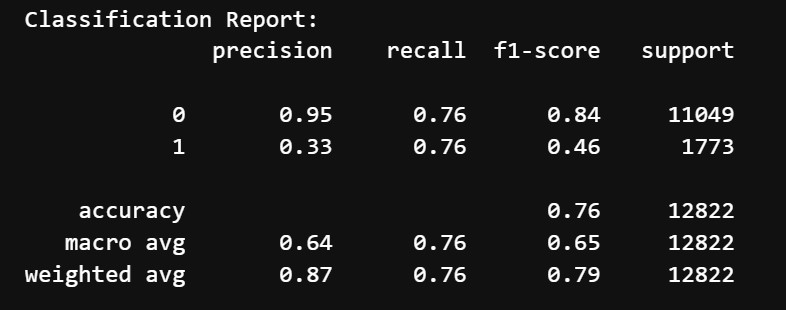
Before hyperparameter tuning and threshold adjustment we got the following results:
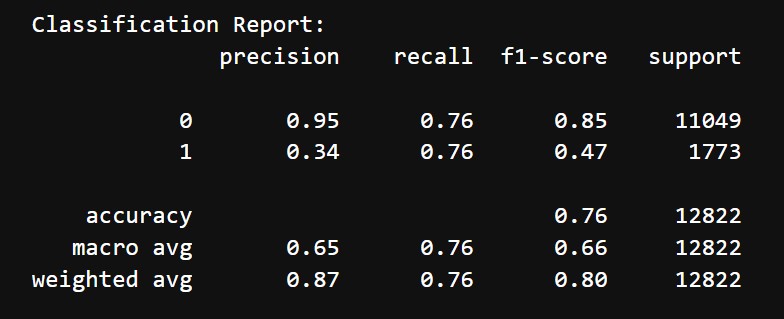
- Accuracy: 76%
- Classification Report:
- Class 0 (Does not mention difficulty):
- Precision: 95%
- Recall: 76%
- F1 Score: 85%
- Class 1 (Mentions difficulty):
- Precision: 34%
- Recall: 76%
- F1 Score: 47%
- Macro Average: Precision = 65%, Recall = 76%, F1-Score = 66%
- Class 0 (Does not mention difficulty):
After tuning and choosing threshold of 0.7, we got the following results:
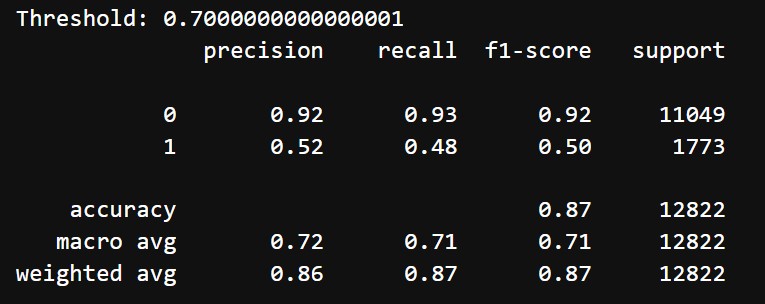
- Accuracy: 87%
- Classification Report:
- Class 0 (Does not mention difficulty):
- Precision: 92%
- Recall: 93%
- F1 Score: 92%
- Class 1 (Mentions difficulty):
- Precision: 52%
- Recall: 48%
- F1 Score: 50%
- Weighted Average: Precision = 72%, Recall = 71%, F1-Score = 71%
- Class 0 (Does not mention difficulty):
After hyperparameter tuning and threshold adjustment, the LightGBM model demonstrated improved balance between the two classes. Initially, the model achieved an accuracy of 76% and a macro average F1-score of 66%, but struggled to identify Class 1 (minority class), with a low precision of 34% and a moderate recall of 76%, resulting in an F1-score of 47%. By tuning hyperparameters and adjusting the decision threshold to 0.7, the model significantly improved its performance for Class 1, with precision increasing to 52%. However, recall for Class 1 dropped to 48%, resulting in a slightly better F1-score of 50%. For Class 0, both precision and recall improved to 92% and 93%, respectively, ensuring robust performance for the majority class. The overall accuracy rose to 87%, with a macro average F1-score of 71%, reflecting a better balance between classes while maintaining high accuracy.
7. XGBoost Classifier Model with “review_length”, “sentiment_score” as input and “mentions_difficulty” as output
We will now use an XGBoost Classifier model to try to model the same relationship as the last one. This model aims to predict whether a review mentions difficulty (mentions_difficulty) using features like review_length and sentiment_score. To handle the class imbalance, a combination of under-sampling and SMOTE was applied to create a balanced training dataset, followed by training an XGBoostClassifier optimized through hyperparameter tuning.
The input dataset looks like this again:
After being normalized it looks like this:
The output classes are imbalanced. They look like this:
We use both undersampling and oversampling and the data now looks like this:
An XGBoostClassifier was used for training. The following default parameters were applied:
- scale_pos_weight: Adjusted to account for residual class imbalance in the resampled data
- n_estimators: Set to 200, representing the number of boosting rounds
- learning_rate: A step size of 0.1 for gradual learning
- max_depth: Limited to 6 to balance complexity and prevent overfitting
- subsample: Randomly sampled 80% of training data for each tree to improve model robustness
- colsample_bytree: Randomly sampled 80% of features for each tree to reduce correlation
Hyperparameter tuning was conducted using GridSearchCV, with 3 fold cross validation, and all the parameters were optimized with respect to F1 Score:
- n_estimators: [100, 200]
- learning_rate: [0.05, 0.1].
- max_depth: [4, 6].
- subsample: [0.8, 1.0].
- colsample_bytree: [0.8, 1.0].
After tuning we also do threshold adjustment from 0.1 to 0.9. A threshold value of 0.8 gave the best results
Before hyperparameter tuning and threshold adjustment we got the following results:
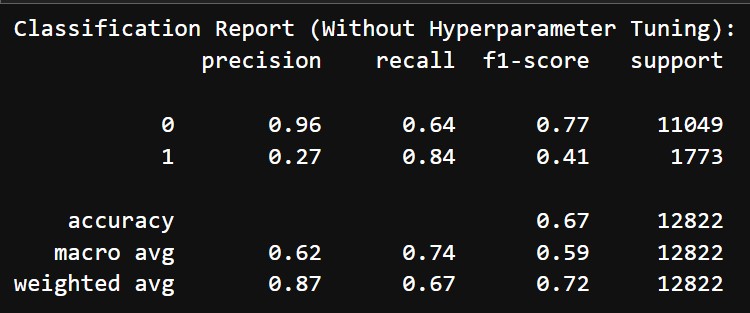
- Accuracy: 67%
- Classification Report:
- Class 0 (Does not mention difficulty):
- Precision: 96%
- Recall: 64%
- F1 Score: 77%
- Class 1 (Mentions difficulty):
- Precision: 27%
- Recall: 84%
- F1 Score: 41%
- Macro Average: Precision = 62%, Recall = 74%, F1-Score = 59%
- Class 0 (Does not mention difficulty):
After tuning and choosing threshold of 0.8, we got the following results:
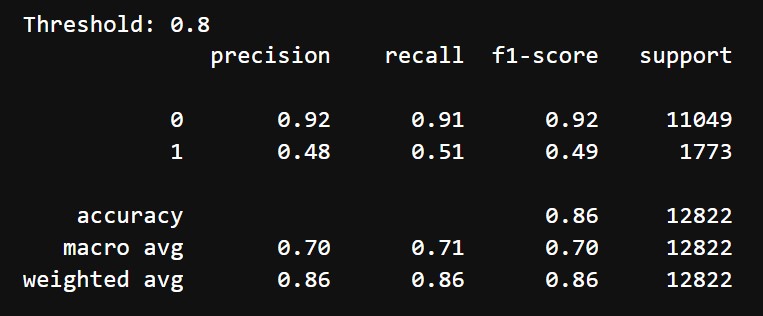
- Accuracy: 86%
- Classification Report:
- Class 0 (Does not mention difficulty):
- Precision: 92%
- Recall: 91%
- F1 Score: 92%
- Class 1 (Mentions difficulty):
- Precision: 48%
- Recall: 51%
- F1 Score: 49%
- Macro Average: Precision = 70%, Recall = 71%, F1-Score = 70%
- Class 0 (Does not mention difficulty):
Initially, the XGBoost model performed moderately well for Class 0, with a precision of 96% and an F1-score of 77%. However, it struggled with Class 1, achieving only 27% precision despite a recall of 84%, resulting in a low F1-score of 41%. The overall accuracy was 67%, indicating difficulty in balancing the two classes. After hyperparameter tuning and threshold adjustment (threshold = 0.8), the model showed improved balance. Class 1 precision increased to 48%, with recall at 51%, leading to a slightly better F1-score of 49%. Class 0 maintained stable performance, with a precision of 92% and recall of 91%, resulting in an F1-score of 92%. The overall accuracy rose to 86%, and the macro average F1-score improved to 70%, reflecting better handling of the minority class without sacrificing much performance for the majority class
8. Ensemble Stacking Model using XGBoost Classifier, Logistic Regression and Naïve Bayes with “review_length”, “sentiment_score” as input and “mentions_difficulty” as output
We will now use an ensemble model of XGBoost, Logistic Regression and Naïve Bayes to model the same relationship. This model combines the predictions from multiple base models using a stacking ensemble to predict whether a review mentions difficulty (mentions_difficulty). The stacking approach leverages diverse models to improve overall performance.
The input dataset looks like this again:
After being normalized it looks like this:
The output classes are imbalanced. They look like this:
We use both undersampling and oversampling and the data now looks like this:
Our base models were the following:
- XGBoost (XGBClassifier): A gradient boosting model configured to handle class imbalance (scale_pos_weight=2) and capture complex relationships
- Logistic Regression: A simple linear model to handle linearly separable patterns
- Gaussian Naive Bayes: A probabilistic model effective with sparse and conditionally independent features
Logistic Regression was used as the meta model to learn how to combine predictions from the base models. 3-fold cross-validation (cv=3) ensured robust training of the meta-model
Hyperparameter tuning was conducted using GridSearchCV to optimize the stacking model:
- XGBoost Parameters:
- n_estimators: [100, 150] (Number of trees)
- max_depth: [4, 6] (Tree depth)
- learning_rate: [0.05, 0.1] (Step size)
- Meta-Model Parameter:
- C: [0.1, 1, 10] (Regularization strength for Logistic Regression)
After tuning we also do threshold adjustment from 0.1 to 0.9. A threshold value of 0.7 gave the best results
Before hyperparameter tuning and threshold adjustment we got the following results:
- Accuracy: 75%
- Classification Report:
- Class 0 (Does not mention difficulty):
- Precision: 95%
- Recall: 76%
- F1 Score: 84%
- Class 1 (Mentions difficulty):
- Precision: 33%
- Recall: 75%
- F1 Score: 46%
- Macro Average: Precision = 64%, Recall = 75%, F1-Score = 65%
- Class 0 (Does not mention difficulty):
After tuning and choosing threshold of 0.7, we got the following results:
- Accuracy: 85%
- Classification Report:
- Class 0 (Does not mention difficulty):
- Precision: 92%
- Recall: 90%
- F1 Score: 91%
- Class 1 (Mentions difficulty):
- Precision: 46%
- Recall: 53%
- F1 Score: 49%
- Macro Average: Precision = 69%, Recall = 72%, F1-Score = 70%
- Class 0 (Does not mention difficulty):
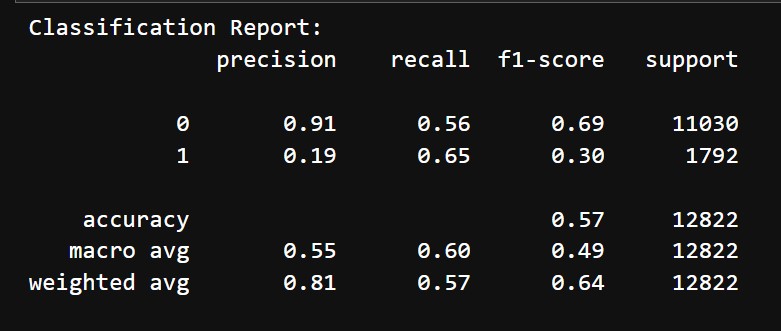
Initially, the model achieved decent results for Class 0, with an F1-score of 84%, but struggled significantly with Class 1, where the F1-score was only 46% due to low precision of 33%. The overall accuracy of 75% highlighted the model's difficulty in handling the minority class, despite reasonable performance for the majority class. After hyperparameter tuning and adjusting the threshold to 0.7, the model's balance between the two classes improved. For Class 1, precision increased to 46%, and recall to 53%, leading to a slightly better F1-score of 49%. Class 0 maintained strong performance, with an F1-score of 91%. The overall accuracy increased to 85%, and the macro average F1-score improved to 70%, showing better class balance while preserving good performance for the dominant class
9. Ensemble Stacking Model using LightGBM, Logistic Regression and Naïve Bayes with “review_length”, “sentiment_score” as input and “mentions_difficulty” as output
We will now use an ensemble model of LightGBM, Logistic Regression and Naïve Bayes to model the same relationship. This stacking ensemble model combines the predictions of three base models—LightGBM, Logistic Regression, and Gaussian Naive Bayes—to predict whether a review mentions difficulty (mentions_difficulty). The final meta-model uses Logistic Regression to combine the predictions from the base models for better overall performance
The input dataset looks like this again:
After being normalized it looks like this:
The output classes are imbalanced. They look like this:
We use both undersampling and oversampling and the data now looks like this:
Our base models were the following:
- LightGBMClassifier: Handles complex patterns and class imbalance with class_weight='balanced'
- Logistic Regression: A simple linear model to handle linearly separable patterns
- Gaussian Naive Bayes: A probabilistic model effective with sparse and conditionally independent features
Logistic Regression combines the predictions of the base models, using 3-fold cross-validation (cv=3) to ensure robust training
Hyperparameter tuning was conducted using GridSearchCV to optimize the stacking model:
- LightGBM Parameters:
- n_estimators: [100, 150] (Number of trees)
- max_depth: [4, 6] (Tree depth)
- learning_rate: [0.05, 0.1] (Step size)
- Meta-Model Parameter:
- C: [0.1, 1, 10] (Regularization strength for Logistic Regression)
After tuning we also do threshold adjustment from 0.1 to 0.9. A threshold value of 0.8 gave the best results
Before hyperparameter tuning and threshold adjustment we got the following results:
- Accuracy: 75%
- Classification Report:
- Class 0 (Does not mention difficulty):
- Precision: 95%
- Recall: 76%
- F1 Score: 84%
- Class 1 (Mentions difficulty):
- Precision: 33%
- Recall: 75%
- F1 Score: 46%
- Macro Average: Precision = 64%, Recall = 76%, F1-Score = 65%
- Class 0 (Does not mention difficulty):
After tuning and choosing threshold of 0.7, we got the following results:
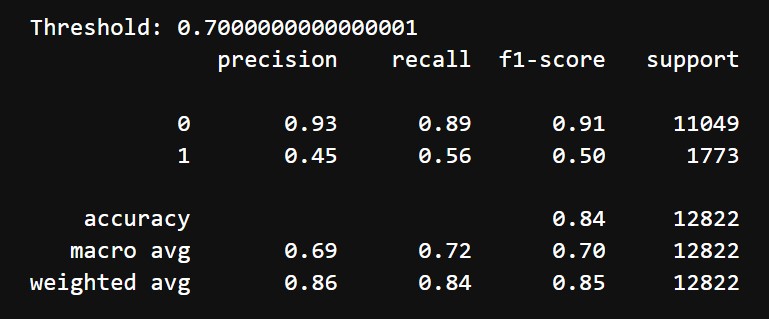
- Accuracy: 88%
- Classification Report:
- Class 0 (Does not mention difficulty):
- Precision: 91%
- Recall: 95%
- F1 Score: 93%
- Class 1 (Mentions difficulty):
- Precision: 58%
- Recall: 43%
- F1 Score: 49%
- Macro Average: Precision = 69%, Recall = 72%, F1-Score = 70%
- Class 0 (Does not mention difficulty):
Initially, the model showed decent performance for Class 0, with an F1-score of 84%, but struggled significantly with Class 1, achieving only 46% due to low precision (33%). The overall accuracy of 76% and a macro average F1-score of 65% indicated a clear imbalance in handling the two classes, with the minority class being poorly identified. After hyperparameter tuning and adjusting the threshold to 0.8, the model achieved better balance. Precision for Class 1 improved significantly to 58%, although recall decreased to 43%, resulting in a slightly improved F1-score of 49%. Class 0 maintained robust performance, with an F1-score of 93% due to high precision (91%) and recall (95%). The overall accuracy increased to 88%, and the macro F1-score rose to 70%.
10. Decision Tree, Random Forest and Logistic Regression Models with genre data as input and "mentions_difficulty" as output
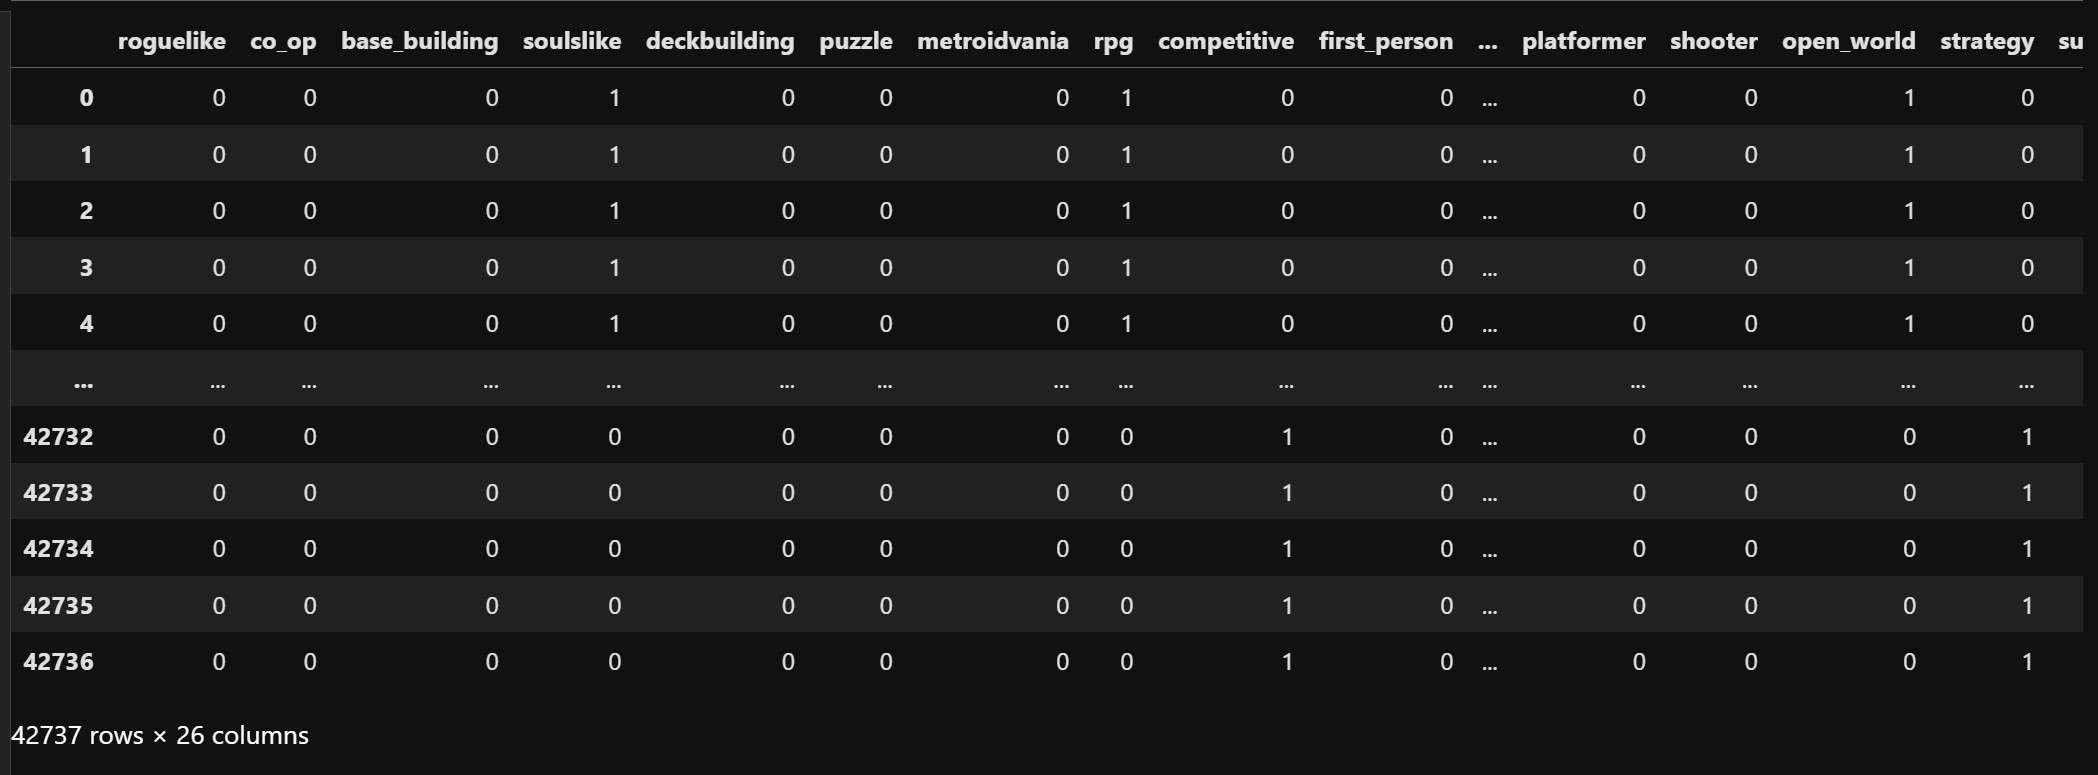
For the next models we will try to predict the relationship between genres and the mentions of difficulty. We will use all our one hot encoded genre columns ('roguelike', 'co_op', 'base_building', 'soulslike', 'deckbuilding', 'puzzle', 'metroidvania', 'rpg', 'competitive', 'first_person', 'crpg', 'multiplayer', 'action', 'sandbox', 'fantasy', 'simulation', 'platformer', 'shooter', 'open_world', 'strategy', 'survival', 'adventure', 'crafting', 'third_person', 'turn_based', '2d') as input and "mentions_difficulty" as output.
Our input data looks like this:
The output class is imabalanced and the counts look like this:
We use SMOTE oversampling. The new counts look like this:
We first implemented a Decision tree model with and then a Random Forest model both with the parameter class_weight="balanced" and other default parameters. Next we implement a Logistic Regression Model with max_iter=1000. All 3 models gave identical results which look like this:
Hyperparameter tuning was done for all 3 of them:
- Decision Tree:
- criterion: ['gini', 'entropy']
- max_depth: [5, 10, 15, None]
- min_samples_split: [2, 5, 10]
- min_samples_leaf: [1, 5]
- Random Forest
- n_estimators: [100, 200]
- max_depth: [5, 10, 15, None]
- min_samples_split: [2, 5, 10]
- min_samples_leaf: [1, 5]
- max_features: ['sqrt', 'log2']
- Logistic Regression:
- C: [0.01, 0.1, 1, 10, 100]
- penalty: ['l1','l2']
- solver: ['liblinear', 'saga']
Even after tuning, all 3 models yield almost the same results again, same as the ones before. These look like this:
Since it produces nearly identical results with all three models, even after tuning, we can conclude that there isn't strong enough evidence in the data to model the mentioned relationship
For a detailed walkthrough of our model implementation process, you can view our full Jupyter notebook here.